Por Lucas De Vivo, Raphael Sá, Rafael Cabral e Daniel Franzolin
- The Machine Learning challenge arose from re.green’s need to reduce the divergence between manual and automated land analyses.
- The ML model plays a key role in the land acquisition and analysis process, providing greater accuracy when classifying restorable areas. This enables a more efficient and assertive approach to decision-making regarding land acquisition.
- With the integration of the model into the algorithm already in use (AMORE), there was a 28.7% reduction in restorable area error and a 10.7% reduction in potential land NPV (net present value) calculation error.
In our article series on how a full-stack project helped re.green, a Brazilian company focused on the restoration of the Amazon and Atlantic Forest biomes through an innovative business mode, make its operations more efficient, we have already covered some important topics. First, we focused on the complete technological solution that accelerated land acquisition.
Then, we detailed the monitoring process and the data architecture that makes it possible. Now, we turn our attention to another key element of this entire project. In this insight, we address the Machine Learning (ML) techniques implemented in the first stage of this large business chain—land acquisition and analysis—designed to reduce discrepancies between manual and automated analyses.
Discover now how EloGroup built and implemented the Machine Learning framework to help re.green tackle this challenge!
What is Machine Learning and how does it differ from other forms of automation
Machine Learning is a subfield of artificial intelligence that enables systems to “learn” patterns and make predictions based on data, without being explicitly programmed for each decision. Unlike other types of automation, such as fixed rules or logic-based scripts, ML can handle complexity, uncertainty, and variations in data.
In traditional automation, for example, a sequence of conditions is defined: “If the image has such a color, classify it as restorable.” In Machine Learning, however, the model is trained with multiple examples of already classified images and, based on these patterns, it learns to generalize and make decisions even when faced with new cases it has never seen before.
This adaptive capability is especially powerful in contexts like re.green’s, which deals with satellite images of varying quality, weather conditions, biomes, and levels of regeneration.
ML allows the system to continuously evolve as new data is incorporated, delivering more accurate and contextualized analyses. This represents a paradigm shift: from rule-based decisions to decisions grounded in statistical learning and empirical evidence.
Why apply Machine Learning in the re.green context
As discussed earlier, the diverse nature of the data handled by re.green makes its operations a strong candidate for the implementation of Machine Learning techniques.
“It was necessary to use an advanced model capable of classifying restorable areas using multispectral images,” says Daniel Franzolin, re.green’s data and modeling specialist.
Initially, ML at re.green was applied to land acquisition, detection, and area classification (for more details on this process, see the first article in this series).
Before the introduction of ML, land analysis was carried out manually by technicians, supported by an algorithm called AMORE.
AMORE stands for re.green’s Restoration Model Allocation Algorithm (in Portuguese). It uses public spatial layers, such as Mapbiomas and SRTM, to perform spatial classification of each pixel within the farm’s perimeter according to its level of restoration, natural regeneration, and mechanization.
This process is essential for automatically defining the allocation of restoration models. However, allocation errors generate financial parameters that do not reflect reality and, consequently, pose economic risks for re.green.
At the same time, AMORE’s spatial sources consider the national spectrum, with a 10x10m resolution and an annual update frequency. These characteristics hinder accuracy and further development, making it necessary to apply more advanced techniques and resources—such as Machine Learning.
The initial focus of ML in this context was to optimize the classification of the restorable area within farms, one of the three core responsibilities of the allocation algorithm.
How the Machine Learning algorithm was implemented
The Machine Learning model was designed to categorize, based on satellite images, which parts of the land have restoration potential and which do not. For this, it uses as input the cadastral polygon that represents the property’s perimeter.
A neural network model was chosen. Rafael Cabral, technical manager of the project at EloGroup, explains the decision: “According to the literature, these are the most recommended for semantic segmentation of remote sensing images. Studies show that even in cases with limited data, neural networks perform better.”
When working with neural network models, a key initial challenge is defining an architecture suitable for the problem at hand. In this case, ResNet was used as the encoder (the initial part of the network, responsible for extracting high-level features from the data).
The decoder—the final part of the network, responsible for processing the information extracted by the encoder and producing the final map of classified areas—was DeepLabV3+, which segments images into parts to identify and separate objects with precision. This choice was made based on a literature review and a critical analysis of the model’s requirements.
Once the architecture was defined, the next step was to train the model so it could learn to capture the specific patterns of each pixel type.
1. Development and training of the ML model
To train the new ML model, 128 land areas were selected. These areas had restorable polygons that had been manually classified and whose satellite images met the minimum quality required for execution.
Due to the small number of available lands for training, validation, and testing, it was necessary to use a method known as sliding windows, which involves dividing the data into smaller windows of a specific size, each processed individually.
By splitting the selected lands into training, validation, and testing sets in an 80%/10%/10% ratio, it was then possible to generate the datasets actually used in the training process.
The training set feeds the model’s learning algorithm, while the validation set is used at each iteration (epoch) to monitor the model’s performance on data outside the training sample. This allows for an overall quality assessment of the model and fine-tuning of hyperparameters—values that determine how the training process unfolds. One of these hyperparameters is the number of epochs, which defines when learning should stop.
Finally, the test set is used to calculate the model’s overall quality metrics, providing insights into its performance on completely unseen data.
This evaluation is critical for deeply understanding the model’s behavior in a production environment, both in purely technical metrics—such as precision, recall, and IOU (intersection over union)—and in business-related metrics, such as the reduction of rework required to correct marked areas.
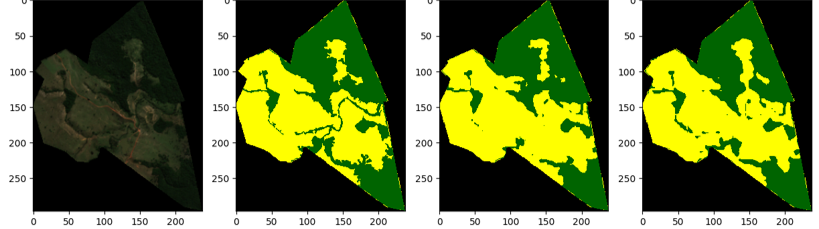
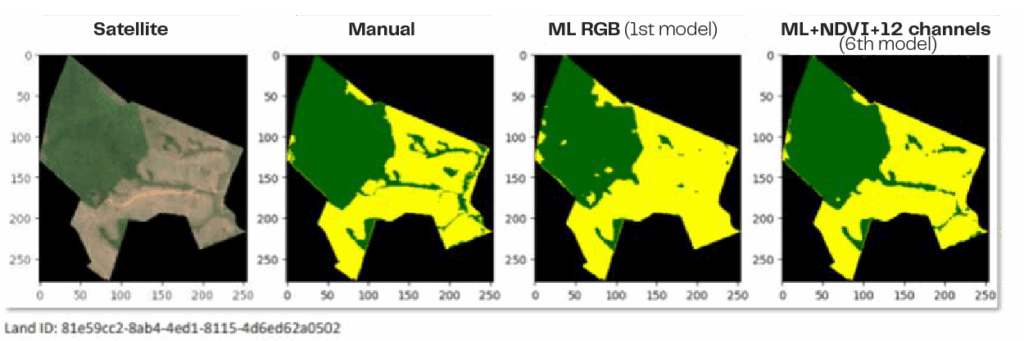
In the images above, it is possible to see a comparison between the satellite image, the manual analysis, and two stages of the ML model training—the latter being the most recent.
2. How the model works
Upon receiving satellite data, the Machine Learning model reads the images and begins categorizing the area as restorable or non-restorable. This is done pixel by pixel (10x10m), while also interpreting nearby pixels to construct smaller polygons within the larger area.
Raphael Sá, manager in charge of the project at EloGroup, explains that for the model to be effective, it was necessary to ensure the use of the most recent images: “To achieve this, a mechanism was implemented to ingest the latest satellite images for each land area. By obtaining them via the Sentinel-2 API, we ensure greater accuracy compared to AMORE, which uses spatial layers like Mapbiomas and SRTM updated only annually.”
For classification, the model uses several parameters based on the acquired image:
- Color (RGB) shown in the photo, indicating the presence of species;
- 12 evaluation channels provided by the satellite itself (spectral bands that capture differences in vegetation condition, moisture, rivers, soil, and coastal areas through electromagnetic waves);
- NDVI (Normalized Difference Vegetation Index), a variable ranging from –1 to 1 provided by Sentinel and calculated from the spectral reflection obtained across the 12 bands, spanning visible red to near-infrared. In short, it measures vegetation density and greenness.
Based on these inputs, the ML model generates an output image in green and yellow, where green represents non-restorable areas (already containing species) and yellow represents restorable areas. These outputs serve as a “map” for subsequent steps.
How the Machine Learning model contributes to the next stages of AMORE
After the restorable area classification by the ML model, the other classifications—natural regeneration and mechanization—follow the same premises as AMORE.
This evaluation categorizes each pixel of the farm according to the following levels:
1. Natural regeneration
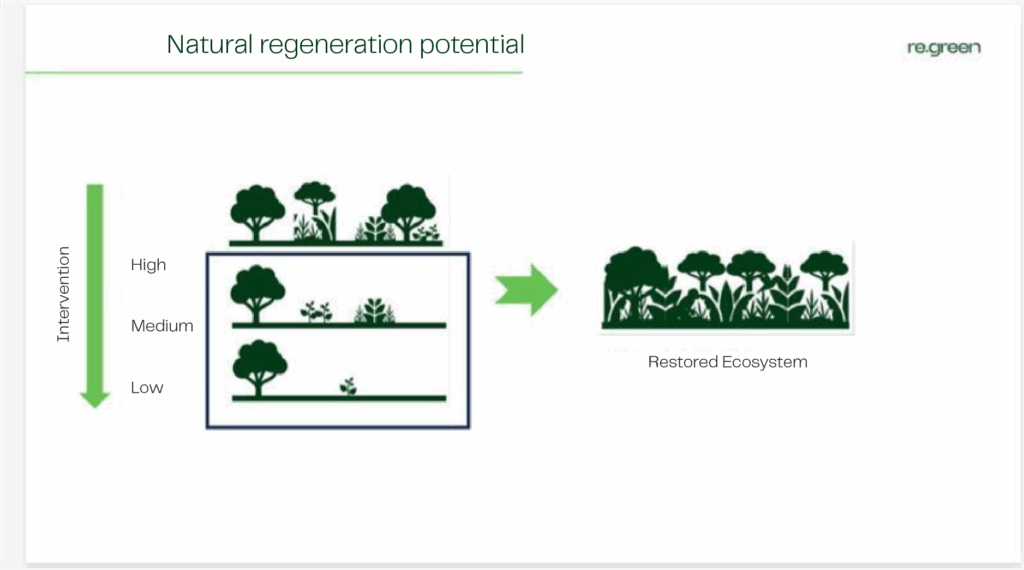
The natural regeneration potential of the land is assessed based on the number of species (trees) present in each evaluated pixel, classifying them as low (BRN), medium (MRN), or high (ARN). This delimitation is performed by AMORE through an analysis of the proximity of forest fragments surrounding each pixel.
Areas with a low presence of regenerating individuals (clean pasture) are classified as having low regeneration potential. In these cases, although the volume of carbon credits generated is higher, restoration costs are greater due to the increased intensity of forest management required.
2. Mechanization
After classifying the degree of natural regeneration, each pixel is classified according to its level of mechanization.
High slope or a high presence of regenerating individuals (ARN – “dirty pasture”) hinders the use of machinery in forest management and requires manual or drone-based techniques.
To perform this classification, the SRTM spatial layer is used, applying slope thresholds for each region, enabling the farm areas to be coded as Y (mechanizable) or N (non-mechanizable).
Machine Learning and land value calculation
In a second stage, the ML model also indirectly influences the calculation of financial parameters such as NPV (Net Present Value) and IRR (Internal Rate of Return) for the analyzed lands, which is essential for the negotiation and acquisition process.
In addition to commercial acquisition conditions and basic financial assumptions—such as carbon generation curves and restoration costs—financial results are directly linked to the allocation of restoration models defined for the analyzed perimeter.
In short, errors in classifying restorable areas, natural regeneration, or mechanization leads to financial results with higher margins of error. The application of the Machine Learning model increased the accuracy of restorable area classification, extending these improvements to the farm’s financial calculation.
“With greater accuracy in restorable area allocation, we indirectly increase the precision of automatic financial calculations. This unlocks automation alternatives in the process that have not yet been implemented, such as automatic approval for negotiation,” explains Raphael.
The adoption of ML in part of the AMORE process reduced restorable area relative error by 28.7% and NPV relative error by 10.7% in the automatic model.
Results
To evaluate the efficiency of the Machine Learning implementation in the spatial analysis process, 60 land areas were selected. The results of the ML model were compared with those from AMORE and manual analyses performed by specialists.
“In the end, the solution showed improvement across all indicators and reduced result variability. This reinforced the thesis that, in the long term, if we increase the volume of annotated restorable areas, we can further improve results through new model training,” notes Rafael Cabral.
From this sample, the median absolute error decreased from 6.85% (AMORE vs. manual analysis) to 2.6% (ML vs. manual analysis). This means the ML automatic model is 62% more accurate in results than the AMORE automatic model.
“As a result, we now have a framework capable of running the ML model fully integrated into the land acquisition workflow (MLops). In short, every land area currently prospected and registered in the application undergoes not only the AMORE automatic model execution but also the automatic execution of the new ML model. This allows us to track results from both automatic executions throughout the entire acquisition funnel across the different management tools used,” says Sá.
Conclusion
The implementation of the Machine Learning model represents a significant advancement in the land acquisition and analysis process for restoration. With greater precision in area categorization, the technology not only improves work efficiency but also ensures a well-founded and assertive approach to decision-making regarding land acquisition.
“It was necessary to use an advanced model capable of classifying restorable areas using multispectral images. Traditional approaches, such as the AMORE algorithm, while useful, had significant limitations due to spatial resolution and the annual update frequency of data, which generated discrepancies between manual and automatic analyses,” points out Franzolin.
By integrating Machine Learning into AMORE, the workflow becomes more efficient, and there is a significant reduction in errors compared to previous results. In the medium and long term, this enhances re.green’s competitive advantage as a player in the carbon credit and timber market.
Daniel also highlights that adopting Machine Learning, particularly neural networks, allowed the team to manage the complexity and variability of satellite data, learning subtle patterns and adapting to different terrain conditions, biomes, and image quality. “This ability to generalize and continuously improve was essential to overcome the limitations of fixed rules and achieve a more accurate and reliable classification of restorable areas,” he adds.
According to Raphael Sá, the provisioned infrastructure paves the way for future advances for re.green’s technology team: “With the provisioned architecture, we have laid the groundwork for continuing ML experiments in automatic analysis. Beyond enabling new training and testing of the current model—focused on restorable area classification—it is possible to expand adoption to optimize other stages of the analysis, such as natural regeneration or mechanization, and even evaluate the use of satellite constellations providing higher resolution,” he concludes.
LUCAS DE VIVO is Content Writer at EloInsights
RAPHAEL SÁ is Project Manager at EloGroup
RAFAEL CABRAL is Data & AI Manager at EloGroup
DANIEL FRANZOLIN is Data and Modeling Specialist at re.green