By Lucas De Vivo, Raphael Sá, Odair Tanes and Fábio Catein
- The socio-environmental monitoring carried out by re.green is complex, spans multiple areas of the business, and requires efficiency, accuracy, and reliable data.
- The monitoring system architecture developed by EloGroup provides high-level automation and delivers clean, up-to-date, and cataloged information directly to the operational front line.
- The workflow operates through the ingestion, processing, storage, and availability of data from various sources in intuitive and simple dashboards.
In the first article of this series on the technology implementation and data intelligence partnership between re.green and EloGroup, we discussed how a full-stack project drastically increased re.green’s ability to identify land for restoration—from 600,000 to around 2 million hectares per year.
Founded in 2022, the Brazilian company’s purpose is to carry out large-scale ecological restoration of forests in the Atlantic Forest and Amazon biomes through an innovative business model based on the sale of high-integrity carbon credits and forest assets. It is an initiative to generate economic value from forests, with significant social and, of course, environmental impact.
But automating land acquisition is only the beginning of the long chain of ecological restoration project development at scale. Monitoring re.green’s projects — carried out through highly rigorous methodologies — is another key step.
Monitoring refers to the systematic and continuous process of data collection, analysis, and interpretation, with the central goal of ensuring restoration quality and quantifying its impacts at both local and landscape levels. In this sense, re.green’s monitoring strategy covers multiple components, including climate, biodiversity, and social aspects.
These components are tracked through the analysis of measurable indicators, following an integrated logic that ultimately makes it possible to assess both the quality of the restoration and the socio-environmental impacts generated.
In this context, the strategic design developed by EloGroup in partnership with the re.green team enabled the implementation of a robust data architecture, in which we played a central role.
Reading this insight, you will learn more about the monitoring efforts led by re.green and how the data architecture supported this process.
Re.green’s monitoring strategy
Re.green’s monitoring strategy was developed to ensure a structured, continuous, and efficient approach to evaluating restoration projects, aligned with MRV (Monitoring, Reporting, and Verification) principles. This process ensures transparency, traceability, and credibility of the information, enabling project progress tracking, validation of environmental impacts, and trusted data-driven decision-making.
Another key aspect of the strategy is to ensure the scalability and reproducibility of analyses, which makes the data architecture a central component for the success and expansion of re.green’s monitoring efforts.
“It’s necessary to guarantee continuous monitoring of the area for at least 50 years, undergoing audit processes with the certifying body. We need to monitor wildfires, illegal deforestation, and other risks. That alone requires the ability to manage a massive volume of data, whether due to the time span or the various formats and sources of data being tracked and evaluated”, explains Raphael Sá, project manager at EloGroup.
The monitoring process covers different themes and business areas, making it a multidimensional discussion. Beyond the high data volume, one of the major challenges is managing data of varying natures and enabling multimodal integrations. It involves a series of critical questions:
Why monitor?
The frequency of monitoring must balance the need for tracking the overall quality of ecological restoration, including precise follow-up, with operational, financial, and commercial demands. This can result in different monitoring frequencies. To illustrate, here are three macro steps along the restoration timeline:
- T0 – Socio-environmental baseline assessment conducted before the start of the restoration project, including, for example, the collection of data on plant and animal species richness, as well as the mapping of local actors and communities.
- Post-planting monitoring – Follow-up during the initial phase of restoration (first three years), supporting decision-making for interventions that optimize forest development, such as tracking mortality rates to guide replanting actions.
- Long-term monitoring – Tracking the restoration trajectory, generally carried out every five years after the project’s initiation, covering aspects related to climate, biodiversity, and communities.
What to monitor?
In the context of re.green, monitoring includes components related to climate, biodiversity, and communities. In partnership with Research & Development institutions such as IIS and ESALQ, re.green developed an integrated monitoring protocol that defines the strategy, components, objectives, and measurable indicators— both qualitative and quantitative.
For each component, a set of indicators is used to evaluate their role within the monitoring protocol, such as:
- Richness of planted native species
- Carbon stock
- Density of regenerating plants
- Altimetric distribution of vegetation
- Diameter distribution of vegetation
- Richness of large mammal species, among others
- Community perceptions regarding the project’s impacts
These are just a few of the indicators applied in the solution, which can be found in more detail and categorized within the re.green monitoring management dashboard, developed in collaboration with EloGroup.
O que monitorar?
No contexto da re.green o monitoramento inclui componentes de clima, biodiversidade e comunidades. A re.green desenvolveu, em parceria com instituições de Pesquisa & Desenvolvimento como IIS e ESALQ, um protocolo de monitoramento integrado, no qual são definidas a estratégia de monitoramento, seus componentes, objetivos e indicadores mensuráveis de forma quali ou quantitativa. Para cada componente há uma série de indicadores que possibilitam avaliar como eles estão inseridos no protocolo de monitoramento, como por exemplo:
- Riqueza de espécies nativas plantadas;
- Estoque de carbono;
- Densidade de plantas regenerantes;
- Distribuição altimétrica da vegetação;
- Distribuição diamétrica da vegetação;
- Riqueza de mamíferos de grande porte, entre outros;
- Percepção das comunidades em relação aos impactos do projeto.
Esses são apenas alguns indicadores aplicados à solução, e podem ser encontrados de maneira mais minuciosa e compartimentada no painel de gestão do monitoramento da re.green, criado em conjunto com a EloGroup.
Re.green’s monitoring flow
Based on the monitoring strategy and indicators defined by re.green, the first step in building an integrated socio-environmental monitoring flow designing an MVP —Minimum Viable Product — i.e., the simplest possible version of a solution that delivers essential features to meet user needs and validate business impact and performance.
In this case, the MVP is a dashboard with consolidated information, connected to a structured and unified database that is continuously fed through the collection and processing of priority indicators of the monitoring strategy.
Currently, the dashboard is intended for internal use at re.green, serving professionals from various departments such as finance, commercial, operations, project development, and management — teams that need to access and verify strategic indicators related to restoration projects.
The primary focus of this database is on ecological restoration projects in lands already acquired by re.green, such as those in the municipalities of Eunápolis (BA), Maraçumé (MA), and Potiraguá (BA), ensuring the availability of the information about those lands to business areas, for processing and using.
Data Architecture of the monitoring dashboard
Due to re.green’s business model and the high specificity of its operations, the monitoring dashboard must deliver information to internal professionals in an automated way—with speed, efficiency, and, above all, high precision.
Additionally, it must ensure correlation across data from multiple sources, both internal and external — such as spreadsheets, the FMS (forest management system), the transactional land acquisition solution, among others.
Therefore, during the design of the MVP, special care was needed to enable a data processing infrastructure capable of handling high data volumes using advanced techniques, providing refined and actionable information for the teams.
The entire data architecture was built in the cloud, with a focus on operational ease and scalability. This setup has a significantly simpler implementation, since there is no need for physical changes to scale or modify structures, unlike an on-premise setup (local servers).
The architecture is based on an ETL (Extract, Transform, Load) process, broken down into four main stages: Extraction, Ingestion, Transformation, and Loading. To support these needs, we used Apache NIFI and Spark.
Below, we detail the key elements of this architecture designed for large-scale data processing.
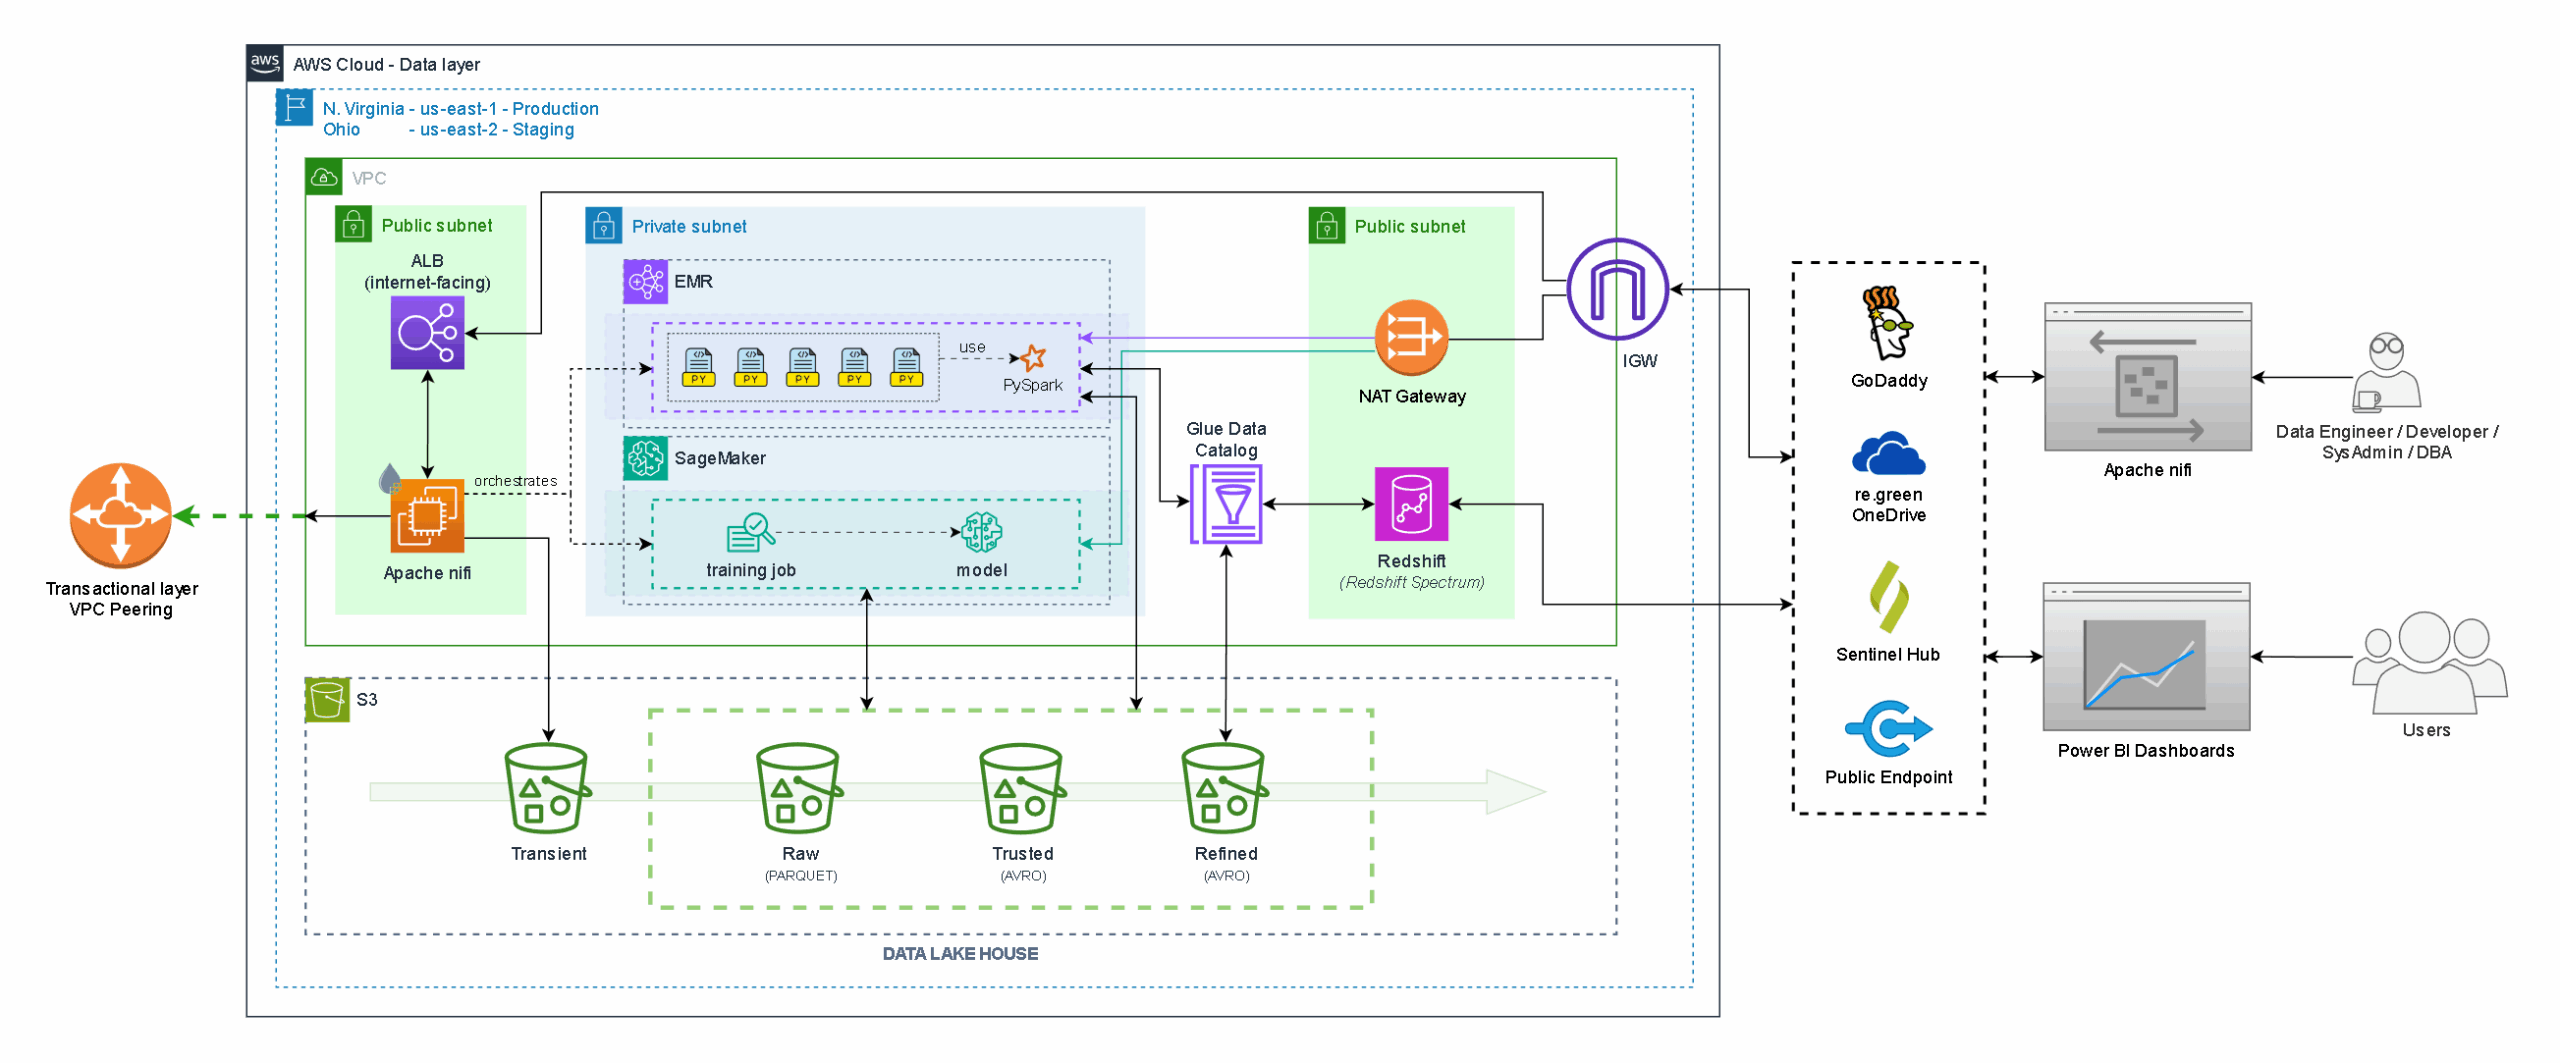
Click to expand
1 – Extraction
Re.green’s files originate from various sources, meaning they can come in different sizes, formats, and storage locations. Some are hosted on Microsoft’s OneDrive, while others are managed directly through forest management systems.
A periodic synchronization process ensures that all documents remain up to date in the storage environment. This guarantees that the most current version of each file is used in the data ingestion phase.
In re.green’s case, a Data Lakehouse approach was adopted — a modern solution that combines the flexibility of a data lake (capable of storing large volumes of raw, diverse data) with the structure of a data warehouse, which facilitates structured analysis and multimodal data integration.
It functions like a “data house” that stores everything in an accessible way, enabling smooth and efficient data exploration without technical complexity.
2 – Ingestion
The ingestion stage is when data is transferred from the original sources to the data layer.
Files are copied in their original format to a temporary directory within the datalake, whose sole function is to store data for a limited period. This layer is referred to as the transient zone.
The files are then read, and their original data (as-is) is parsed and written in Parquet format—a structure specifically designed to separate metadata (such as version, type, etc.) from the actual data content.
The information is then transferred to another bucket called Raw. This marks the beginning of the Transformation phase.
3 – Transformation
The data transformation phase begins with an initial refinement of the information, which includes, for example, removing duplicates, renaming columns, and eliminating null values.
These files are then converted into the AVRO format and moved to a bucket called Trusted. At this stage, the data is clean, reliable, and ready for processing. While Parquet and AVRO are not formats specifically designed for handling multimodal data directly, they can be used to organize metadata and structure references to different types of data, enabling the serialization of complex information in architectures that integrate multiple data modalities.
After the actual processing (transformation) is complete, the information is moved to the Refined bucket, where the data is now ready to be consumed by both business and technical areas. An AWS cloud service called Glue Data Catalog is used to catalog this logically structured data.
Another service, Redshift, provides an SQL-based query interface over the Lakehouse-stored data.
4 – Loading
The processed data goes through a formatting step so that it can be visualized and integrated into a Power BI dashboard or, if needed, into other business-specific systems.
In the loading phase, all the information remains stored in the cloud and can be accessed directly from the final layer of the data architecture. Therefore, there is no need for extensive data transfers or downloads. The information is secure, and access is properly managed.
What are the results of implementing the monitoring dashboard?
The complete re.green monitoring dashboard was implemented in 2024 and delivered significant results, particularly in reducing the time required to complete certain tasks.
“Today we have a data layer capable of supporting the ingestion, processing, storage, and availability of monitoring data in a single environment, correlating its various themes and sources, such as field data collected by service providers, the forest management system, and external databases,” explains Raphael.
The results are noteworthy: easier access to information, real-time data updates, and the ability to ingest data from multiple sources and in any format, among other benefits.
“Data structuring is the foundation upon which information and knowledge are built. EloGroup’s work gives us the first building blocks for the vast construction of knowledge around the restoration we are carrying out,” says Sara Mortara, project specialist at re.green.
Moreover, the flexibility of the infrastructure allows the model to scale to new areas and demands, keeping pace with re.green’s ambitious growth.
“At re.green, we deal with highly diverse data — environmental, social, and carbon-related — which must be organized in a structured way to support our certification processes. The built architecture has enabled us to handle this information with precision and ensure the traceability required to validate our projects,” adds Arthur Lisboa, technology coordinator at re.green.
Conclusion
High-quality ecological restoration with positive impacts on climate, biodiversity, and people is one of the greatest environmental challenges of our time, as it involves recovering degraded ecosystems and reestablishing their socio-ecological processes.
Large-scale ecological restoration demands not only technical and scientific expertise but also robust technological infrastructure and the ability to make decisions based on reliable data.
The innovative business model developed by re.green makes this mission more tangible, structured, secure, and scalable, supported by a high degree of technical and scientific knowledge and operational rigor.
Building an effective data architecture to meet the demands of monitoring, with highly variable and diverse indicators and information, proved to be a path that required extensive study and deep knowledge of the company’s operations.
“Bringing a business-driven perspective to consumption was (and continues to be) essential for value creation. This required close collaboration with the re.green team to define key indicators, raise business questions, and build the monitoring management dashboards,” says Raphael.
Designed with continuous improvement in mind, the dashboards and the entire data architecture were created not only to serve the current operation efficiently, but also to meet greater business demands and scale, supporting re.green’s growth with a foundation of data intelligence.
“Long-term monitoring is a key pillar of re.green’s strategy for restoring ecosystems at scale. With EloGroup’s support, we’ve built a robust and scalable data architecture capable of ensuring traceability, credibility, and the long-term success of our projects,” concludes Arthur.
LUCAS DE VIVO is a Writer at EloInsights
ODAIR TANES is a Principal Engineer at EloGroup
FABIO CATEIN is a Senior Data Engineering Specialist at EloGroup
RAPHAEL SÁ is a Manager at EloGroup