By Kênia Alves, Leonardo Matos and Nuria Rojo
The reality of remote work has imposed new challenges for companies’ organization and people management.
Data analysis tools help to gain a deeper understanding of strategic projects’ organization, as well as the culture of company meetings and the reality of their employees.
Case studies help to exemplify how analyzing this type of information may guide new initiatives that provides better results in terms of productivity and well-being.
With the onset of the Covid-19 pandemic, many organization’s were forced to migrate their on-site work structures to the remote model – even though many of them were unprepared for this abrupt transformation.
The migration to the home office and to a rising virtual working environment had the effect of increasing the volume of emails sent (as well as those unread and forgotten in inboxes), meetings and conference calls. As a result, reports of exhaustion, stress levels and the workload of employees have increased.
According to the traditional magazine HR Executive, the number of employees showing alarming levels of stress, fatigue or risk of depression in the United States has increased by 102% during the pandemic.
In this same scenario, it became more complex for the People Management areas to keep track of their employees’ routines. Interaction between teams was done through e-mails, chats and virtual meetings; this kind of data is unknown or difficult to access. It became even more complex to monitor the healthiness of the work routine, the level of employee engagement, as well as assessing the need for corporate wellbeing initiatives and checking the impact of these initiatives on employee workload to avoid the opposite of the expected result.
Some companies were already looking for a more people-centered, data-driven approach; others, even more mature, were already using collaboration data from their technology packages to predict points of focus and take quick, assertive action on their employees’ well-being. These were the organizations that were ahead in the race to adapt in the context of the pandemic and that felt the impact of the changes the least.
For companies that had not yet structured their people analytics cells or teams, the appearance on the market of proprietary collaboration data consumption tools was an opportunity to solve this problem.
Collaboration data consumption tools
Large companies already established in the data market found the challenge of remote working a way to spread their collaboration data consumption tools, allowing organizations to access information from Microsoft Teams, Zoom, Google Meet and various other communication and work management platforms.
These tools combine data on collaboration time in activities – such as sending emails, chats and meetings – with organizational information (structure, areas and hierarchies) and internal initiatives (retention and turn-over, churn, performance evaluations, etc.), making it possible to obtain relevant insights for promoting change and optimizing work culture.
Some tools also provide structured analyses in reports and visualizers. In this way, companies with a low level of analytical maturity can have a broader view of their people analytics indicators, such as the percentage of employees at risk of burnout, the total volume of meeting hours and other details.
Based on this information, organizations, both more and less mature, can reorganize themselves to bring more quality to the workplace. To illustrate this, below we will present a use case for Microsoft’s Workplace Analytics tool and how collaboration data can support the discussion of health in the workplace.
A case study of People Analytics
The specific challenge of the case we are about to detail was the diagnosis within an organization of the well-being situation of employees, as well as the establishment of recommendations for initiatives.
Assessing employee well-being is a challenge for both the People Management department and the leadership. In the home office context, due to the Covid-19 pandemic and its implications for collective mental health, this dare has become increasingly complex and necessary.
The Employee Well-being axis of Workplace Analytics allows us to delve deeper into this research using different indicators:
- Amount of time dedicated to collaborative activities (emails, meetings and chats);
- Volume of hours spent collaborating after work hour;
- Volume of focus hours (a time window of at least 2 hours between meetings);
- Size of the working week (the daily sum of hours between the first and last activities of the day); and
- Volume of occupation in the working week (the ratio between the number of hours of collaboration and the size of the working week).
Based on these indicators, it is possible to map which areas of the organization have employees most at risk of burnout.
In the project carried out by EloGroup, two main questions were asked to deepen this analysis:
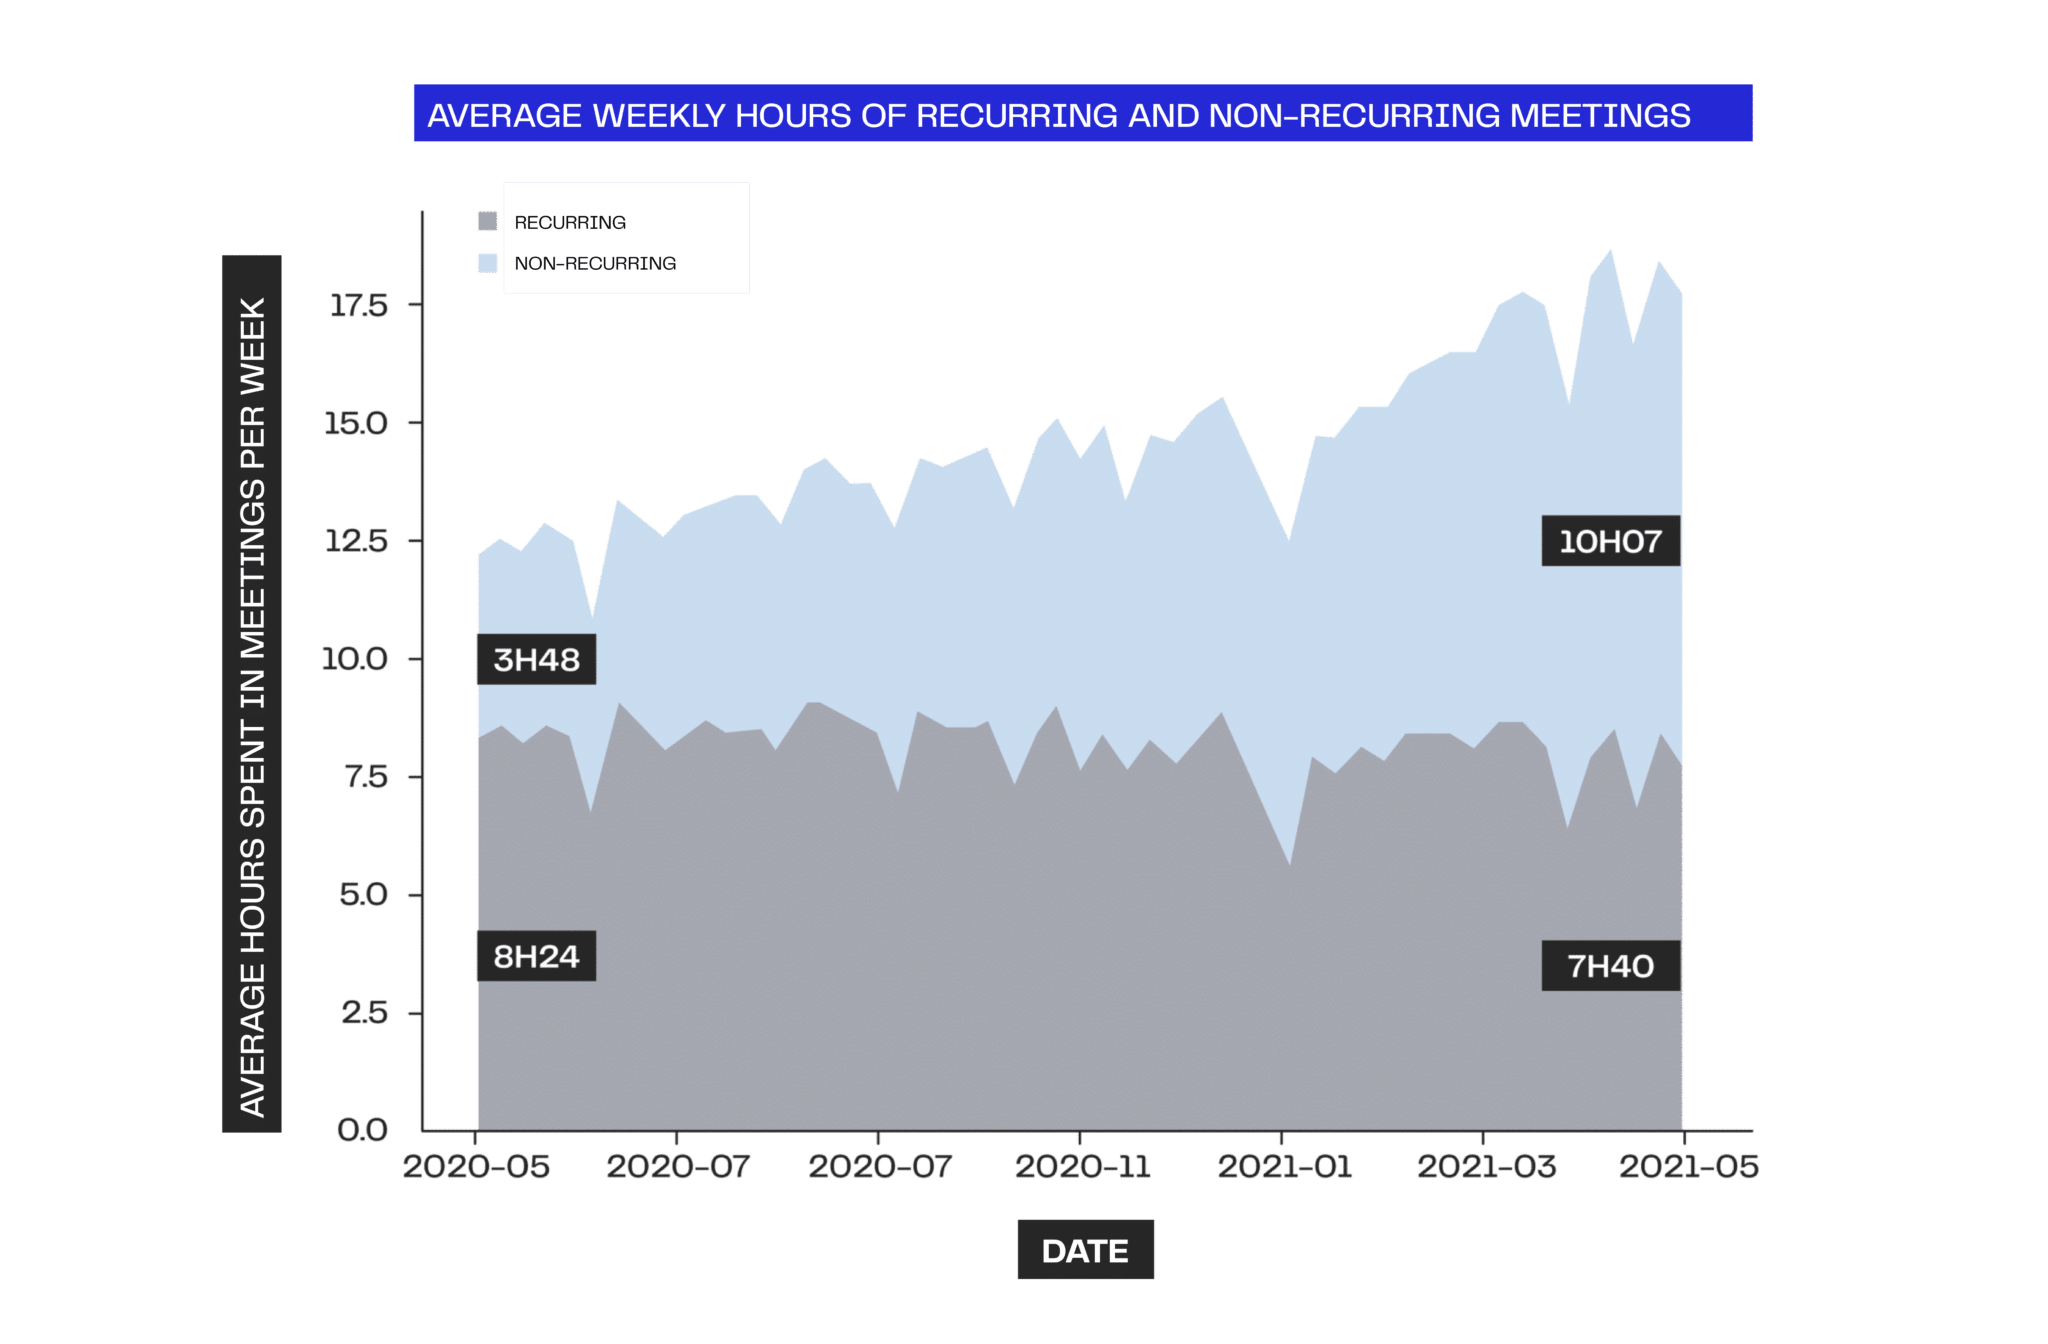
1. What impact does the volume of meetings have on the pace of work?
Since the adoption of the home office in this company, the average number of meeting hours per week has increased. Over the period observed, the average number of hours spent in recurring meetings increased by 6h19 (166%), while the average number of hours spent in non-recurring meetings decreased by 44 minutes (9%). Overall, employees experienced a 46% increase in the volume of meetings.
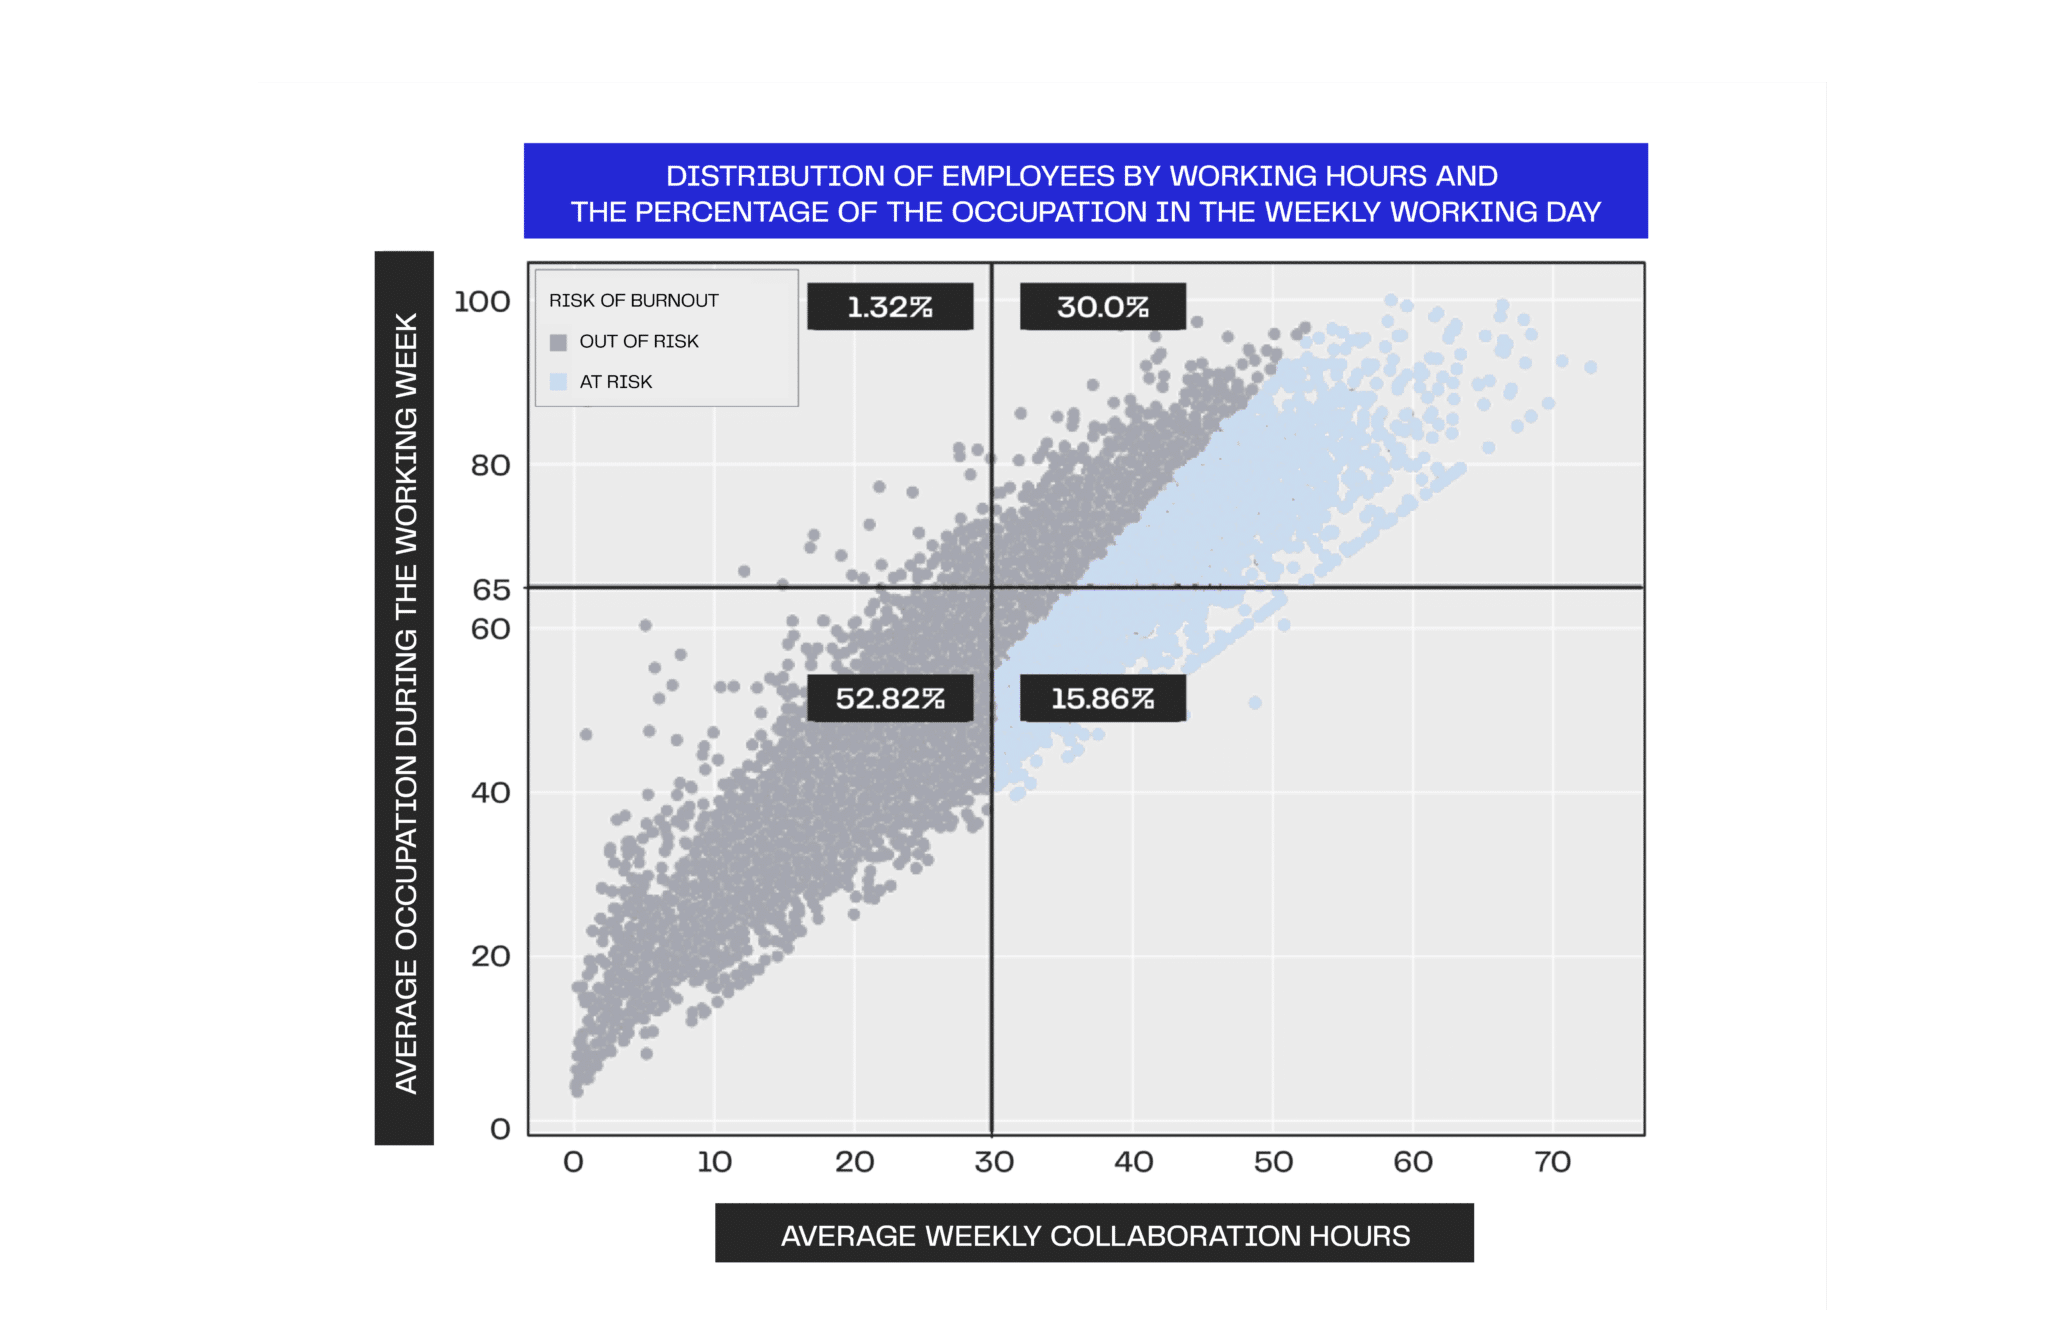
2. What is the risk scenario for burnout?
According to Microsoft’s classification, employees with more than 30 hours of collaboration per week and more than 55 hours of working time per week are potentially at risk of burnout.
However, it is important to delve deeper into this analysis, given that, in a flexible work context, a high workweek interval value (average daily hours between the first activity and the last activity) can occur without necessarily indicating a high workload. For example, employees may take longer breaks during meals or start their working day earlier because of personal activities.
Therefore, employees at risk of burnout were analyzed according to the percentage of occupation in the weekly working day and the average number of hours of collaboration.
The analysis of the increase in meetings and employees at risk of burnout provides a first diagnosis, as well as highlighting and sizing up the well-being problem faced by the company. The next step is to understand what measures should be proposed to improve this scenario. Still using collaboration data, we can analyze the meeting culture and talent management practiced in companies.
Targeting initiatives: meeting culture and talent management as wellbeing levers
In the context of companies’ meeting culture, the following indicators can be worked on:
- Volume of time dedicated to long meetings;
- Volume of time dedicated to recurring meetings;
- Distribution of time in strategic and alignment meetings;
- Evaluation of engagement in meetings and multitasking behavior.
These indicators are important for identifying how productive time is being organized and how it can be optimized, thus reducing the workload of employees.
During the diagnostic stage, a 46% increase in the volume of meetings was identified. The way this volume was distributed, and the impact of strategic initiatives were some of the points questioned during the project:
1. Has the time dedicated to meetings provided a productive environment?
As a starting point, we tried to assess how the company distributed its meeting hours in terms of size and duration.
From this analysis, it was concluded that the company concentrated around 64% of its time on meetings considered to be long or large – meetings with 19 or more participants and/or lasting more than an hour.
2. What about when we analyze strategic initiatives and projects?
The next step was to assess how the company’s strategic initiatives were organized in day-to-day work. To do this, we worked on grouping meeting times based on the title of the agendas.
By looking into the strategic initiatives, we saw that the problem of organizing meetings had intensified – with around 83% of meeting time in the long or large group, which showed a great opportunity to gain productivity and reorganize the work routine. The multitasking rate, obtained from the time spent sending emails by meeting participants, was 2.8%. This is considered high when it is above 20%.
Talent management
Besides increasing productivity and reducing workloads, focusing on employee engagement and development is fundamental to improve and keep well-being in the organization.
The People Management team undoubtedly plays a key role in talent management, but much of the work must be done by leaders. When it comes to talent, Workplace Analytics explores the collaboration patterns of leaders and their relationship with their team members.
In this context, some indicators that can be discussed and deepened are:
- Volume of collaboration by leaders;
- Percentage of employees who have had 1:1 meeting (in this case, the size and frequency of these meetings can be analyzed);
- Volume of meetings attended by the leader and the team members.
The project initially mapped the volume of 1:1 meeting held in the organization, as well as the possible impacts of this volume:
1. Is there a culture of 1:1 meeting with the leaders?
In the project, it was found out that 90% of the organization’s employees had only 15 minutes or less of 1:1 meeting with their leaders every week, and 24% had none at all. Collaboration data, along with other organisational information, was therefore used to delve deeper into this problem and its possible impacts.
The first hypothesis tested was whether the size of the leader’s team had an influence on the amount of time spent in 1:1 meeting with those they lead, as it is natural that with a larger team, leaders have less time available. But was this true in practice?
In fact, at distinct levels of leadership, a low correlation was found between the so-called “Span of Control” and the number of hours of 1:1 meeting held by the leader.
Another line of enquiry was about the length of time the employee was with the company, especially looking at the first three months, the onboarding period considered, and after onboarding. The analysis revealed that after the onboarding period the 1:1 time was 62% higher than for those with less than three months in the company.
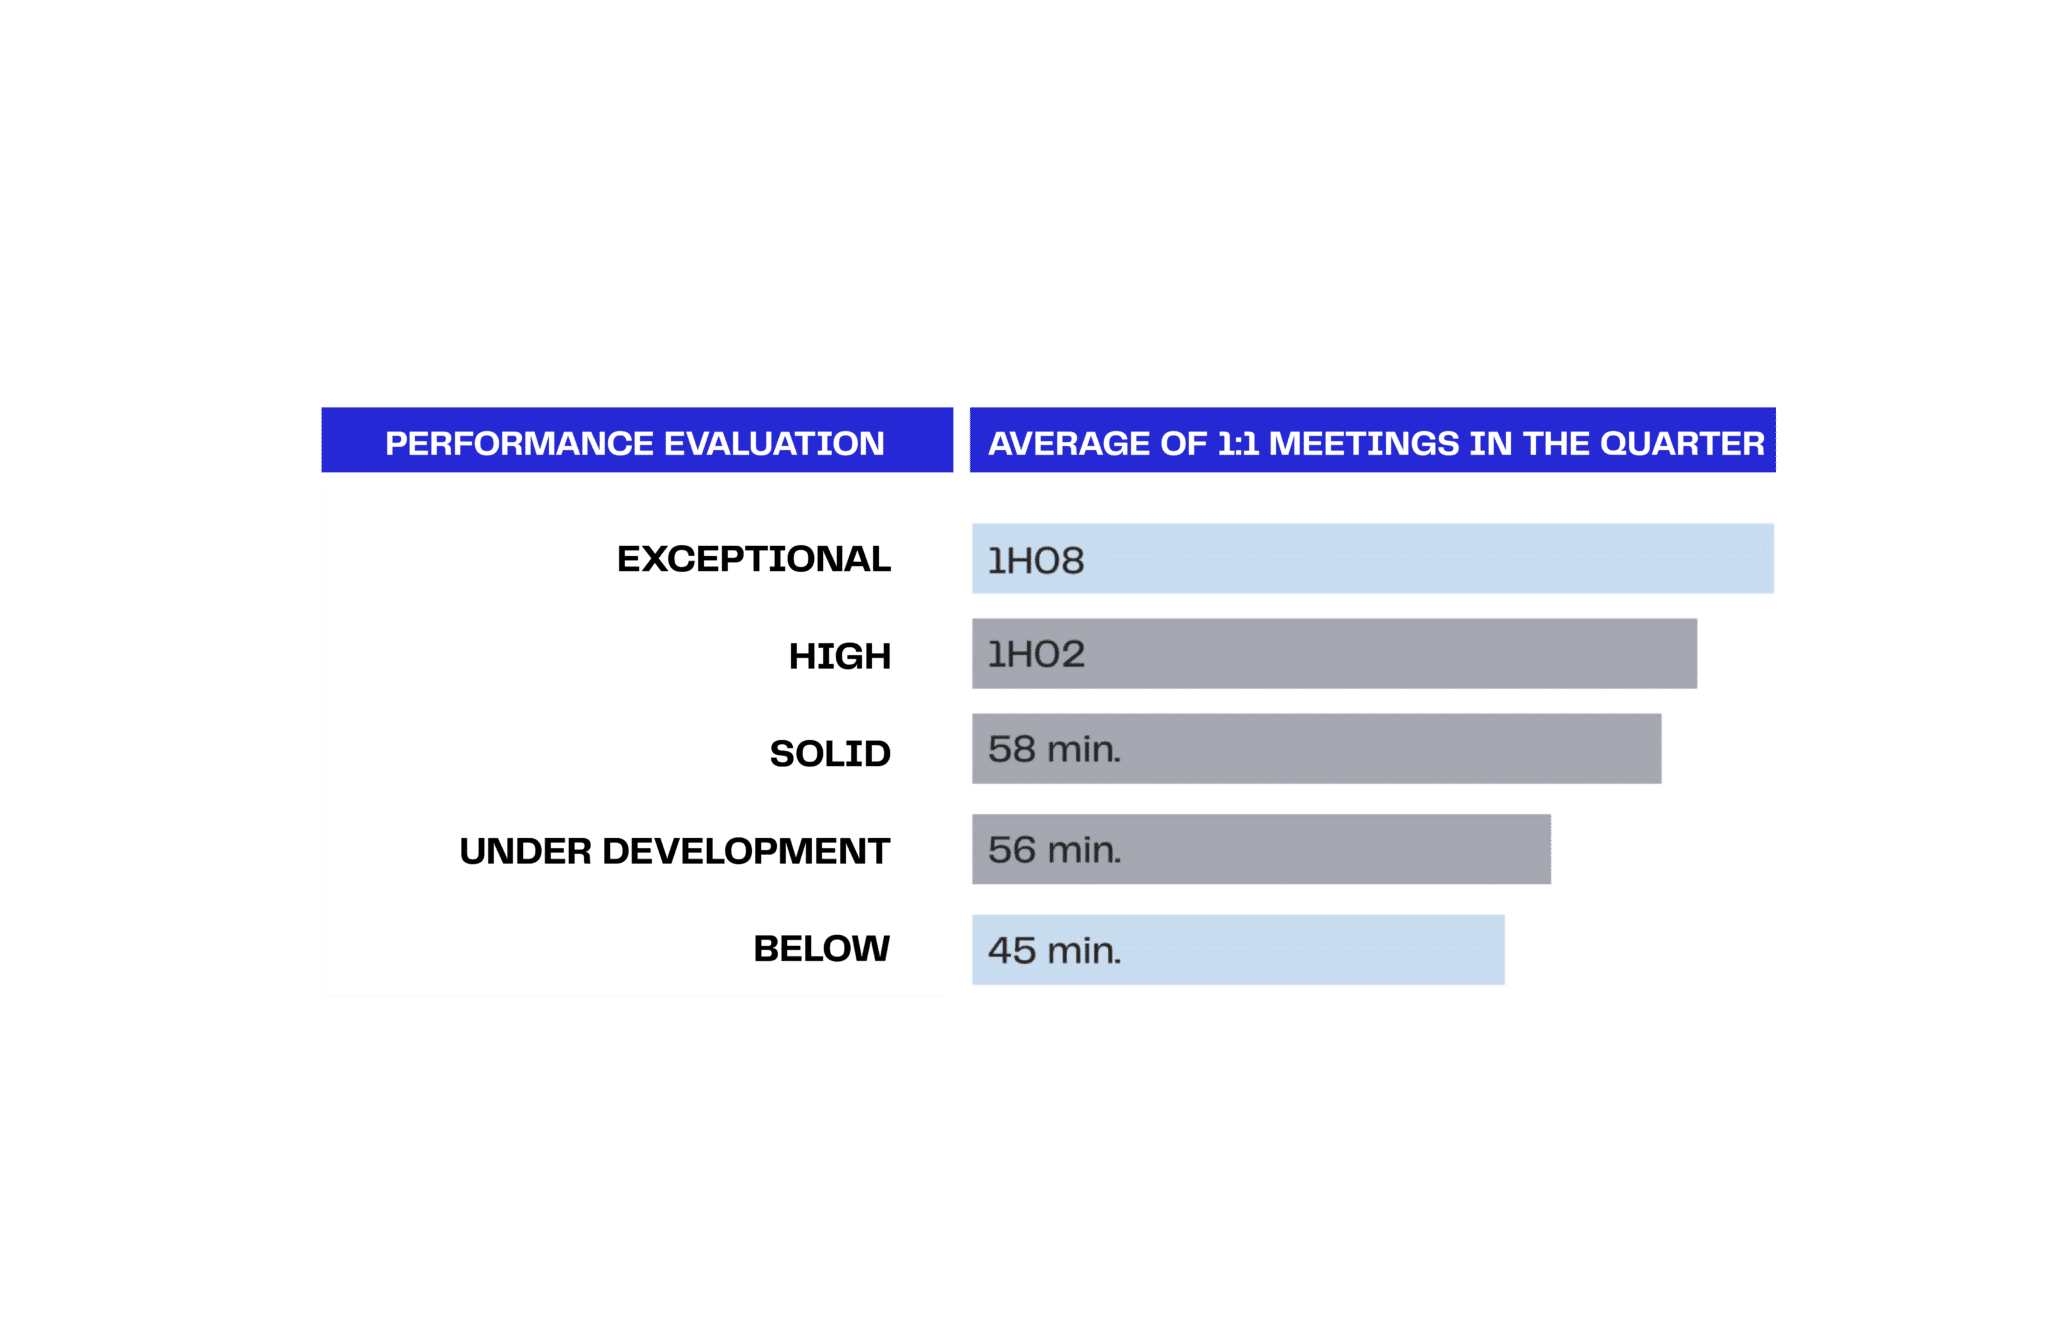
2. What impact does hold 1:1 meeting with leaders have on performance and recognition?
Firstly, when evaluating employee recognition, it was found that employees who had been promoted within a year received significantly more 1:1 meeting with their leaders than employees who had not been promoted. The correlation between the volume of 1:1s and the performance rating was also analyzed.
What is next? Taking Action
With all this data and intelligence in hand, the company could now review the way leaders and teams organized their activities and had been applying agility concepts and routines to their projects appropriately, targeting wellbeing initiatives. It is worth highlighting the importance of balancing alignment and 1:1 meeting with general team meetings and workshops, thus reducing the time spent in large meetings and making room in employees’ diaries so that they can be directed towards effective production.
From a talent management perspective, it was clear that leaders generally spent little time in 1:1 meeting and that some groups of employees showed even lower results.
In cases like such, structuring an onboarding plan that includes more interaction and training with leaders, as well as including a mentoring system with leaders in the development plan for low-performing employees, are initiatives that can boost results.
These are just a few examples of the potential of collaborative data analysis, and how it is being increasingly exploited. Beyond the so-called Organisational Network Analysis (ONA), in the context of teleworking, collaboration data is a key element in boosting employee productivity and well-being.
Collaboration data consumption tools, linked to organisational data, make it possible to make an in-depth diagnosis of the organization’s well-being scenario and, based on the deployment of other levers, such as meeting culture and talent management, to direct initiatives that generate results.
KÊNIA ALVES works as Business Consultant at EloGroup.
LEONARDO MATOS works as Senior Analytics Consultant at EloGroup.
NURIA ROJO works as Senior Digital Transformation Consultant at EloGroup.