By João Gabriel Domingos
This article explores the challenge of sizing and composing teams within organisations of different natures.
Staff productivity is a lever of competitiveness, even in key sectors, and can be worked on smart ways without breaking up the organisation.
EloGroup’s case study in an energy company proves how it is possible to assess staff allocation from an organisational perspective and not just in terms of specific functions.
Whenever executives assess the staff productivity of the organisations they lead, usually in cyclical stages (more specifically, during the budget period), some questions become relevant and come to mind:
How big should my team be? How many leaders do I need? Does the team need a junior or senior profile?
However, there are specific contexts that may require even more this reflection. Nowadays, for example, it is an unavoidable task to answer these questions in the light of the spread and impact of Generative AI. What will be the ideal composition of teams after the transformation of processes integrating the use of AI?
We know that staff productivity is an important competitive lever, even in key sectors such as energy and sanitation. And we also know that organisations want to structure themselves intelligently, avoiding future pitfalls such as the need for lay-offs and major cuts, which can even have a damaging knock-on effect, breaking up teams and negatively affecting overall productivity.
In this article, we will present a successful EloGroup’s case which involved applying the lenses of sizing, seniority analysis and Span & Layers to an energy company that runs in various regions of Brazil.
Customer pain and diagnosis
The project started from a specific pain: the company realised that it was not cost-competitive, which could pose a threat to its sustainable growth. We were then called in to organise their analysis method and find opportunities to increase efficiency.
Once the problem was presented, the first step was to organise the available cost data and adapt it to the Activity-based Costing (ABC) allocation method, like other companies in the sector do. From that, the organisation was able to compare its costs using an econometric model to estimate an optimum curve. In addition, it became possible to identify in which offenses there were more opportunities: in which processes or activities, and in which resources.
From this diagnosis, it was concluded that the biggest deviation of OPEX (Operating Expenses) from the ideal curve was concentrated in the People line.
Steps and lenses used
With the diagnosis defined, the project went through the following stages:
- Benchmarking: organisation of operating cost data and comparison with other companies in the sector;
- High-level assessment of the main staff productivity opportunities: after presenting an operating cost reference curve, the main offenses (areas, processes and resources) were identified; and
- Sizing and definition of actions to optimise headcount: definition of the ideal team size and actions to make this vision of the future viable.
The lenses chosen to tackle the organisation’s pains were:
- Sizing: how many people should each team have?;
- Seniority: what is the ideal distribution of people between senior, full and junior levels?; and
- Span & Layers: what is the ideal ratio between leaders and subordinates?
These lenses were chosen based on benchmarking, that showed that staff costs were higher than expected for a company with the same operational characteristics. Apart from payment (which was not the subject of the project), the other offenses had to be related either to the number of employees (leaders or not) or to the level of seniority of the employees.
The method of applying the lenses involved surveys, semi-structured interviews, workshops, analyses of personnel data and analyses of operational and financial indicators.
Sizing's implementation stages
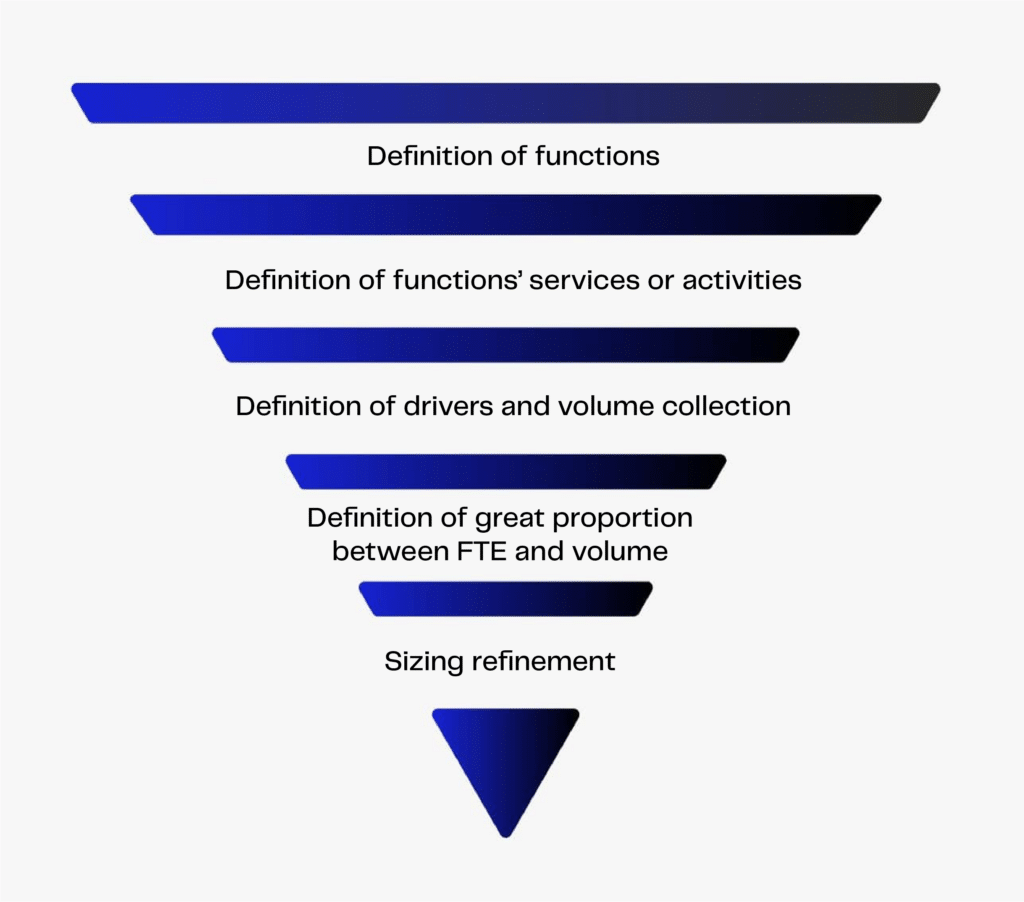
Once the application lenses had been set up, the first step was to define the ideal size of a team for this organisation based on the delivery of value through the services or activities carried out. To do this, we took the following steps:
- Definition of functions: creation of groups formed by professionals with similar positions;
- Definition of the services or activities of the functions: understanding the scope of each function;
- Definition of drivers and collection of volumetrics: definition of which indicators had a high correlation with the function’s working hours;
- Defining the optimum ratio between FTE (Full-Time Equivalent, a unit of value used to measure an employee’s workload) and volume: in other words, understanding how many hours would ideally be needed for each unit of volume; and
- Refining the sizing: depending on the characteristics and criticality of each of the functions, we defined work shifts; or compared the ideal allocation of the function with benchmarks of similar functions; or, in addition, measured in real time how much time was spent carrying out activities or delivering critical services.
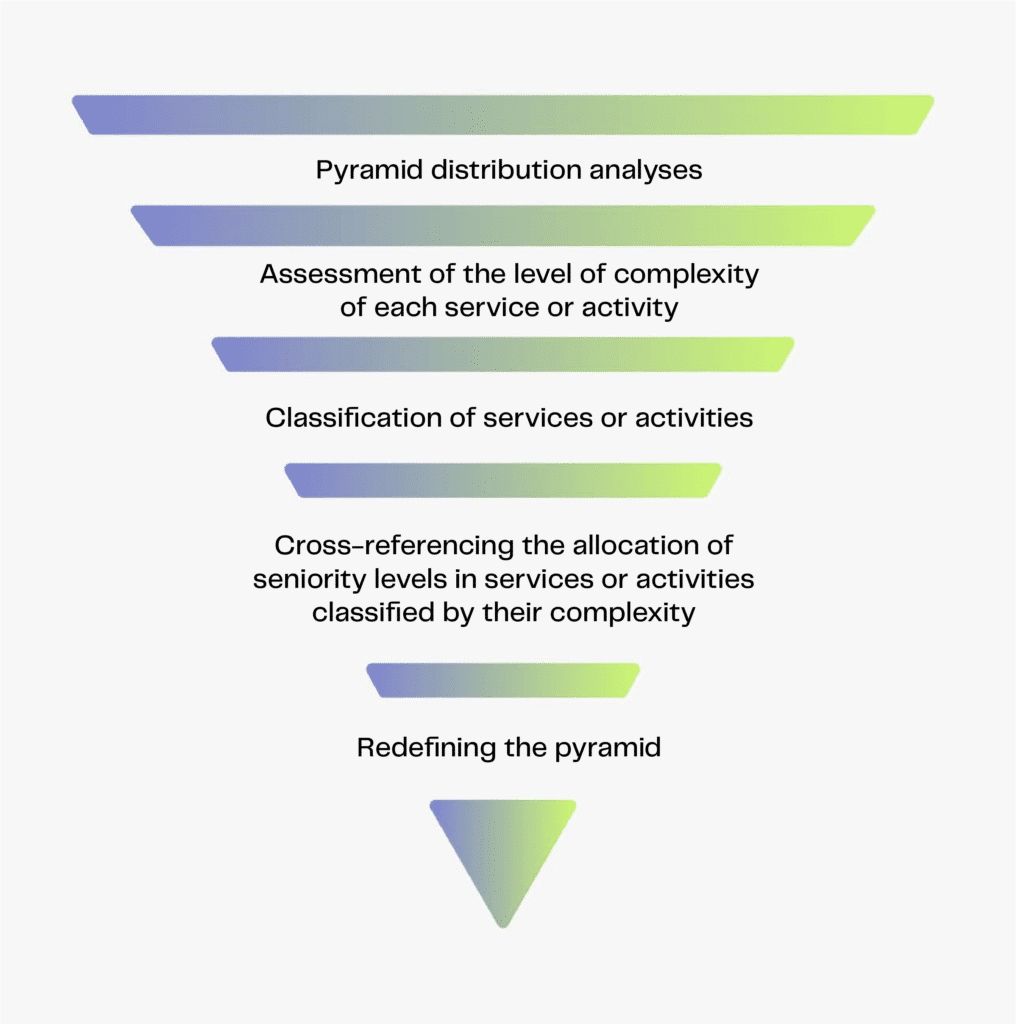
Knowing how many FTEs were needed to fill a particular role, we took a second route by defining how to distribute these FTEs across the various levels of seniority (usually junior, full and senior). To do it, we took the following steps:
1- Pyramid distribution analysis: we mapped the seniority levels of each function, understanding how the organisation was distributed;
2- Assessment of the level of complexity of each of the services or activities: by collecting the allocation of employee hours, we assessed the services based on the following complexity factors:
- Volume of demand;
- Predictability of activities;
- Flow variations; and
- Risk mitigation.
3- Classification of services or activities: based on complexity factors, we classify services or activities according to their nature:
- Execution-intensive activities (task-based);
- Activities that mix execution and knowledge (hybrid);
- Knowledge-intensive activities (skill-based).
4- Cross-checking the allocation of seniority levels in services or activities classified by their complexity: we assess the correspondence between complexity and seniority, finding opportunities to optimise allocation; and
5- Redefining the distribution of the pyramid: we redistribute the hours allocated by employees to each of the services in the levels of the pyramid based on the percentages defined for the different classifications.
Challenges and the importance of leadership support
The main challenge of the project was to break down the organisational silos and make the discussion of staff productivity global, but not necessarily homogeneous between the areas. Even though there are principles that should be common (for example, the idea that higher seniority should be allocated to more complex processes), the opportunities for staff productivity will be greater in some areas than in others.
Changing the productivity level of an organisation is a decision that needs to be sponsored by the C-Level (executive level), as these are transformations that challenge the organisation greatly. In this case, the participation of the CFO and the Finance team (as “evangelists” of the transformation) was fundamental to guaranteeing the recommendations’ implementation.
Gains
Considering the current level of assets under management as the benchmark, the proposed headcount considered an 8% reduction in the number of staff, with the decrease in the senior layer being more significant, at 31%. This transformation meant a shrinkage of up to 7.5% in operating costs.
As there was, at the time of the project, a prospect of growth in the asset base, the company implemented the recommendation by slowing down headcount growth and replacing senior positions with more junior ones using natural turnover, rather than an abrupt reduction in teams. As a non-quantitative gain, the project awakened the leadership’s concern and discipline for Operational Excellence.
Conclusion and EloGroup approach
This article shows how Staff Productivity projects can be carried out at scale (for the whole company) by calibrating the level of depth in each of the functions. And Productivity projects must have the intense participation not only of the Operations team, but also of the Finance.
Usually, cases such as the one presented here is based on benchmarking by industry and company size. At EloGroup, though, we offer a customised approach, considering the client’s contextual elements. This customisation is essential since, for example, comparisons between energy companies are generally limited, as they operate under a concession model and are therefore necessarily in different geographical territories (they are not entirely comparable).
Is your company facing productivity challenges? Talk to us!
JOÃO GABRIEL DOMINGOS works as Manager at EloGroup.